# Rapport de TP 1
Exercice 1:
Problématique : Identification des caractéristiques dans les images (ship1, ship2, castle1, castle2).
Solution : Les étapes sont les suivantes :
1. Utilisation de la fonction OpenCV (cv2.cornerHarris()) pour repérer les caractéristiques dans les images ship1 et ship2.
2. Confirmation visuelle de la résistance de l'algorithme Harris à la rotation. Visualisation de castle1 et castle2.
3. Mise en œuvre de SURF, remplacé par SIFT sans dépendance de brevets
````python
// Code ship1
```notebook-python
!git clone https://github.com/Jjioo/TP1_cv
%cd /content/TP1_cv/
%cd images/
import cv2 as cv
import numpy as np
import matplotlib.pyplot as plt
# Charger l'image 1 (ship1)
img_path = './ship1.pgm'
img = cv.imread(img_path)
# Convertir l'image en niveaux de gris
gray = cv.cvtColor(img, cv.COLOR_BGR2GRAY)
# La détection de coins de Harris à l'image en niveaux de gris
dst = cv.cornerHarris(np.float32(gray), 2, 3, 0.04)
# Créer une copie de l'image pour afficher l'img originale
img_with_corners = img.copy()
# Mettre en surbrillance les coins en rouge
img_with_corners[dst > 0.01 * dst.max()] = [0, 0, 255]
# Afficher l'image originale et l'image avec les coins détectés
plt.figure(figsize=(10, 5))
plt.subplot(1, 2, 1)
plt.imshow(cv.cvtColor(img, cv.COLOR_BGR2RGB))
plt.title('Image originale')
plt.subplot(1, 2, 2)
plt.imshow(cv.cvtColor(img_with_corners, cv.COLOR_BGR2RGB))
plt.title('Coins détectés')
plt.show()
```
````
Résultat 1
Note importante : Les points identifiés correspondent aux caractéristiques détectées par l'algorithme Harris Corner, visibles en rouge.
```
"""
Détection de coins avec Harris :
Calculer les gradients dans les deux directions.
Créer la matrice H à partir des gradients.
Calculer les valeurs propres de H.
Identifier les points avec une forte réponse (λmin > seuil).
"""
```
````python
// Code ship1
```notebook-python
import cv2 as cv
import numpy as np
import matplotlib.pyplot as plt
# Charger l'image 2 (ship2)
img_path = './ship2.pgm'
img = cv.imread(img_path)
# Convertir l'image en niveaux de gris
gray = cv.cvtColor(img, cv.COLOR_BGR2GRAY)
gray = np.float32(gray)
# La détection de coins de Harris à l'image en niveaux de gris
dst = cv.cornerHarris(gray, 2, 3, 0.04)
# Créer une copie de l'image pour afficher l'img originale
img_with_corners = img.copy()
# Mettre en surbrillance les coins en rouge
img_with_corners[dst > 0.01 * dst.max()] = [0, 0, 255]
# Afficher l'image originale et l'image avec les coins détectés
plt.figure(figsize=(10, 5))
plt.subplot(1, 2, 1)
plt.imshow(cv.cvtColor(img, cv.COLOR_BGR2RGB))
plt.title('Image originale')
plt.subplot(1, 2, 2)
plt.imshow(cv.cvtColor(img_with_corners, cv.COLOR_BGR2RGB))
plt.title('Coins détectés')
plt.show()
```
````
Résultat 2
Note :
Vérification visuelle de la robustesse de l'algorithme Harris face à la rotation :
```notebook-python
"""
On constate clairement sa robustesse à la rotation, avec une invariance
rotationnelle, conformément à l'une des propriétés d'Harris
(selon le cours).
"""
```
````python
// Code castle1
```notebook-python
import cv2 as cv
import numpy as np
import matplotlib.pyplot as plt
# Charger l'image 3 (castle1)
img_path = './castle1.jpg'
img = cv.imread(img_path)
# Convertir l'image en niveaux de gris
gray = cv.cvtColor(img, cv.COLOR_BGR2GRAY).astype(np.float32)
# Détection de coins de Harris à l'image en niveaux de gris
dst = cv.cornerHarris(gray, 2, 3, 0.04)
# Créer une copie de l'image pour afficher l'img originale
img_with_corners = img.copy()
# Mettre en surbrillance les coins en rouge
img_with_corners[dst > 0.01 * dst.max()] = [0, 0, 255]
# Afficher l'image originale et l'image avec les coins détectés
plt.figure(figsize=(10, 5))
plt.subplot(1, 2, 1)
plt.imshow(cv.cvtColor(img, cv.COLOR_BGR2RGB))
plt.title('Image originale')
plt.subplot(1, 2, 2)
plt.imshow(cv.cvtColor(img_with_corners, cv.COLOR_BGR2RGB))
plt.title('Coins détectés')
plt.show()
```
````
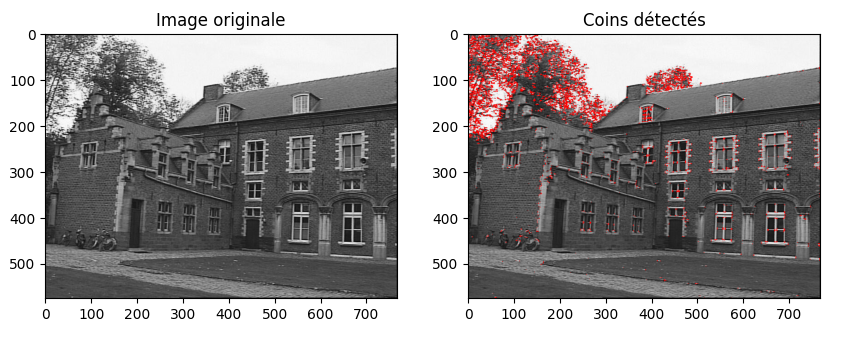
Résultat 3
````python
// Code castle2
```notebook-python
import cv2 as cv
import numpy as np
import matplotlib.pyplot as plt
# Charger l'image 4 (castle2)
img_path = './castle2.jpg'
img = cv.imread(img_path)
# Convertir l'image en niveaux de gris
gray = cv.cvtColor(img, cv.COLOR_BGR2GRAY).astype(np.float32)
# Détection de coins de Harris à l'image en niveaux de gris
dst = cv.cornerHarris(gray, 2, 3, 0.04)
# Créer une copie de l'image pour afficher l'img originale
img_with_corners = img.copy()
# Mettre en surbrillance les coins en rouge
img_with_corners[dst > 0.01 * dst.max()] = [0, 0, 255]
# Afficher l'image originale et l'image avec les coins détectés
plt.figure(figsize=(10, 5))
plt.subplot(1, 2, 1)
plt.imshow(cv.cvtColor(img, cv.COLOR_BGR2RGB))
plt.title('Image originale')
plt.subplot(1, 2, 2)
plt.imshow(cv.cvtColor(img_with_corners, cv.COLOR_BGR2RGB))
plt.title('Coins détectés')
plt.show()
```
````
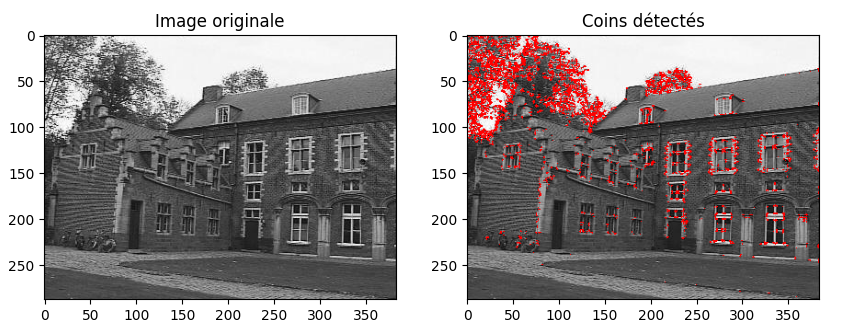
Résultat 4
Note :
```notebook-python
"""
Obtiendrez-vous le même résultat sur les images castle1 et castle2 ?
L'invariance à l'échelle est observée, la réponse demeure similaire même
en réduisant la taille de l'image, une propriété inhérente au détecteur
de Harris (conformément au cours).
"""
```
{% code overflow="wrap" %}
````python
// Code 5 : Ship1 avec SIFT pour détecter des features dans une image
```notebook-python
import cv2
import matplotlib.pyplot as plt
def detect_and_visualize_sift_features(image, nfeatures=100, title="SIFT Features"):
sift = cv2.SIFT_create(nfeatures=nfeatures, contrastThreshold=0.04, edgeThreshold=10.0)
keypoints, descriptors = sift.detectAndCompute(image, None)
print(f"Number of keypoints detected: {len(keypoints)}")
image_with_keypoints = cv2.drawKeypoints(
image,
keypoints,
None,
color=(0, 0, 255), # Red color
flags=cv2.DRAW_MATCHES_FLAGS_DRAW_RICH_KEYPOINTS
)
return image_with_keypoints, title
# Charger l'image 1 (ship1)
img_path = './ship1.pgm'
img = cv2.imread(img_path)
# Convertir l'image en niveaux de gris
gray = cv2.cvtColor(img, cv2.COLOR_BGR2GRAY)
# Détecter et visualiser les features SIFT sur l'image ship1
ship1_img, ship1_title = detect_and_visualize_sift_features(gray, nfeatures=100, title='SIFT Features on Ship1')
# Créer une copie de l'image pour afficher les features SIFT
img_with_sift_features = ship1_img.copy()
# Ajuster la taille de la figure pour une sortie plus grande
plt.figure(figsize=(10, 5))
# Visualiser l'image originale et l'image avec les features SIFT détectés
plt.subplot(121)
plt.imshow(cv2.cvtColor(gray, cv2.COLOR_BGR2RGB))
plt.title('Image originale')
plt.subplot(122)
plt.imshow(cv2.cvtColor(img_with_sift_features, cv2.COLOR_BGR2RGB))
plt.title('Features SIFT détectés')
plt.show()
```
````
{% endcode %}
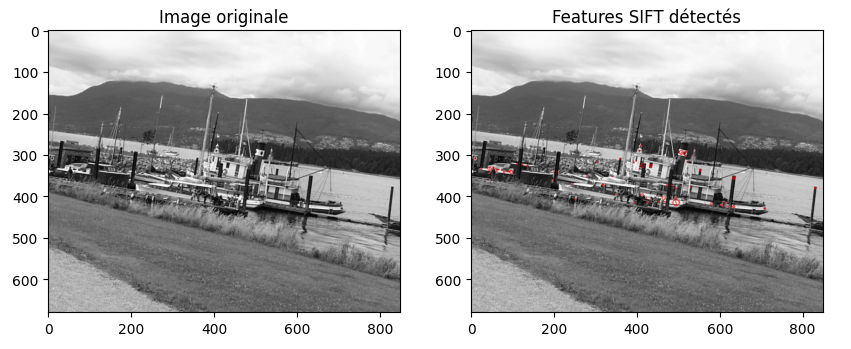
Résultat 5 - -Ship1
Note :
```
"""
Les caractéristiques que SIFT a détectées sont clairement visibles
"""
```
Résultat 5 - -Ship2
Note :
```
"""
Invariance à la rotation : Les points d'intérêt (PIs) détectés par SIFT
restent invariants lors de la rotation de l'objet.
Les descripteurs des points d'intérêt demeurent stables même en cas de
légère rotation de l'objet.
"""
```
Résultat 6 - -castle1
Résultat 6 - -castle2
Note :
Les caractéristiques SIFT sont détectées sur les contours, les coins et les textures de l'image, qui sont susceptibles de rester les mêmes même si l'image est agrandie ou réduite.
Cela est dû au fait que les caractéristiques SIFT sont invariantes à l'échelle, ce qui signifie qu'elles sont détectées à différentes échelles de l'image. Cette propriété est essentielle pour de nombreuses applications de vision par ordinateur, telles que la reconnaissance d'objets, la recherche d'images basée sur le contenu et la cartographie.
Exercice 2 et 3: (construire une image panoramique à partir de plusieurs images.)
Problématique : Estimation des paramètres de transformation. Testez votre programme avec les images des séquences case1 et case2. Explorez l'amélioration des résultats en utilisant la méthode du RANSAC pour estimer les paramètres de transformation.
Solutions :
* Employez svd(Z).
* Implémentez la méthode du RANSAC.
````python
// Code : campus_01 et campus_02.
```notebook-python
import cv2 as cv
import numpy as np
from google.colab.patches import cv2_imshow
def resize_image(img, scale_factor):
return cv.resize(img, None, fx=scale_factor, fy=scale_factor)
def detect_and_compute_orb(img):
orb = cv.ORB_create()
keypoints, descriptors = orb.detectAndCompute(img, None)
return keypoints, descriptors
def get_matched_points(descriptors1, descriptors2):
bf = cv.BFMatcher(cv.NORM_HAMMING, crossCheck=True)
matches = bf.match(descriptors2, descriptors1)
matches = sorted(matches, key=lambda x: x.distance)
matched_points2 = np.float32([keypoints2[match.queryIdx].pt for match in matches])
matched_points1 = np.float32([keypoints1[match.trainIdx].pt for match in matches])
return matched_points1, matched_points2
def create_perspective(img1, img2, matched_points1, matched_points2):
if len(matched_points1) >= 4 and len(matched_points2) >= 4:
M, _ = cv.findHomography(matched_points2, matched_points1, cv.RANSAC, 5.0)
h1, w1, _ = img1.shape
h2, w2, _ = img2.shape
corners1 = np.float32([[0, 0], [0, h1], [w1, h1], [w1, 0]]).reshape(-1, 1, 2)
corners2 = np.float32([[0, 0], [0, h2], [w2, h2], [w2, 0]]).reshape(-1, 1, 2)
corners2_transformed = cv.perspectiveTransform(corners2, M)
corners = np.concatenate((corners1, corners2_transformed), axis=0)
x_min, y_min = np.int32(corners.min(axis=0).ravel())
x_max, y_max = np.int32(corners.max(axis=0).ravel())
transformed_offset = (-x_min, -y_min)
transformed_image = cv.warpPerspective(img2, M, (x_max - x_min, y_max - y_min))
transformed_image[transformed_offset[1]:h1 + transformed_offset[1], transformed_offset[0]:w1 + transformed_offset[0]] = img1
cv2_imshow(transformed_image)
else:
print("Pas assez de points pour estimer l'homogénéité")
# Load and resize images
img_path1 = './campus_01.jpg'
img_path2 = './campus_02.jpg'
img1 = resize_image(cv.imread(img_path1), 0.25)
img2 = resize_image(cv.imread(img_path2), 0.25)
# Detect and compute ORB features
keypoints1, descriptors1 = detect_and_compute_orb(img1)
keypoints2, descriptors2 = detect_and_compute_orb(img2)
# Get matched points
matched_points1, matched_points2 = get_matched_points(descriptors1, descriptors2)
# Create perspective transformation and display the result
create_perspective(img1, img2, matched_points1, matched_points2)
```
````
Résultat
````python
// Code case1 :
```notebook-python
import cv2
from google.colab.patches import cv2_imshow
# Load the 5 images.
img1 = cv2.imread("./case1/1.JPG")
img2 = cv2.imread("./case1/2.JPG")
img3 = cv2.imread("./case1/3.JPG")
img4 = cv2.imread("./case1/4.JPG")
img5 = cv2.imread("./case1/5.JPG")
images = [img1, img2, img3, img4, img5]
# Initialize a list of images
imgs = []
for i in range(len(images)):
imgs.append(cv2.resize(images[i], (0, 0), fx=0.4, fy=0.4))
# Showing the original pictures
for i in range(len(imgs)):
cv2_imshow(imgs[i])
# Stitching
stitcher = cv2.Stitcher_create()
status, panorama = stitcher.stitch(imgs)
if status != cv2.Stitcher_OK:
# Checking if the stitching procedure is successful
# .stitch() function returns a true value if stitching is
# done successfully
print("Stitching ain't successful")
else:
print('Your Panorama is ready!!!')
# Final output
cv2_imshow(panorama)
cv2.waitKey(0)
cv2.destroyAllWindows()
```
````
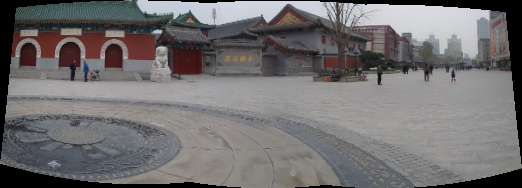
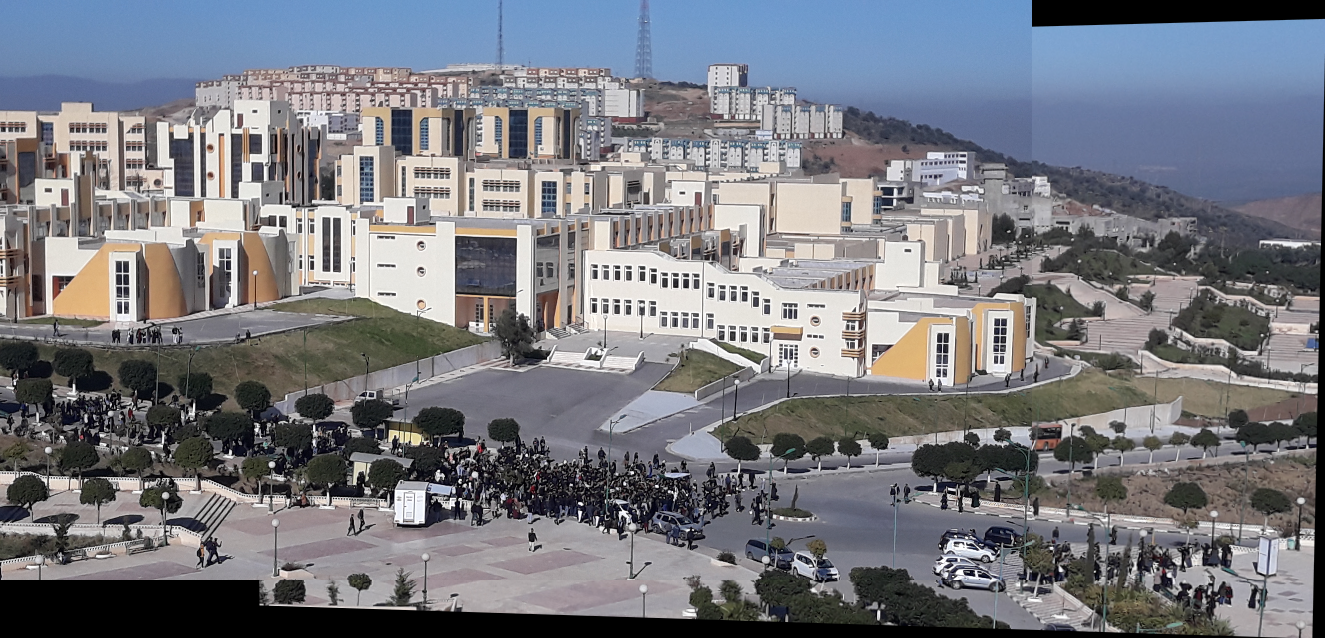
Résultat case1
Résultat case2
Exercise 4 :
````python
```notebook-python
import cv2
from google.colab.patches import cv2_imshow
img1 = cv2.imread("./case3/01.jpg")
img2 = cv2.imread("./case3/02.jpg")
img3 = cv2.imread("./case3/03.jpg")
img4 = cv2.imread("./case3/04.jpg")
img5 = cv2.imread("./case3/05.jpg")
img6 = cv2.imread("./case3/06.jpg")
img7 = cv2.imread("./case3/07.jpg")
img8 = cv2.imread("./case3/08.jpg")
img9 = cv2.imread("./case3/09.jpg")
img10 = cv2.imread("./case3/10.jpg")
images = [img1, img2, img3, img4, img5,img6,img7,img8,img9,img10]
# Initialize a list of images
imgs = []
for i in range(len(images)):
imgs.append(cv2.resize(images[i], (0, 0), fx=0.4, fy=0.4))
# Showing the original pictures
for i in range(len(imgs)):
cv2_imshow(imgs[i])
# Stitching
stitcher = cv2.Stitcher_create()
status, panorama = stitcher.stitch(imgs)
if status != cv2.Stitcher_OK:
# Checking if the stitching procedure is successful
# .stitch() function returns a true value if stitching is
# done successfully
print("Stitching ain't successful")
else:
print('Your Panorama is ready!!!')
# Final output
cv2_imshow(panorama)
cv2.waitKey(0)
cv2.destroyAllWindows()
```
````
case 3
````python
```notebook-python
import cv2
from google.colab.patches import cv2_imshow
img1 = cv2.imread("./case4/01.JPG")
img2 = cv2.imread("./case4/02.JPG")
img3 = cv2.imread("./case4/03.JPG")
img4 = cv2.imread("./case4/04.JPG")
img5 = cv2.imread("./case4/05.JPG")
img6 = cv2.imread("./case4/06.JPG")
img7 = cv2.imread("./case4/07.JPG")
img8 = cv2.imread("./case4/08.JPG")
img9 = cv2.imread("./case4/09.JPG")
img10 = cv2.imread("./case4/10.JPG")
img11 = cv2.imread("./case4/11.JPG")
img12 = cv2.imread("./case4/12.JPG")
images = [img1, img2, img3, img4, img5,img6,img7,img8,img9,img10,img11,img12]
# Initialize a list of images
imgs = []
for i in range(len(images)):
imgs.append(cv2.resize(images[i], (0, 0), fx=0.4, fy=0.4))
# Stitching
stitcher = cv2.Stitcher_create()
status, panorama = stitcher.stitch(imgs)
if status != cv2.Stitcher_OK:
# Checking if the stitching procedure is successful
# .stitch() function returns a true value if stitching is
# done successfully
print("Stitching ain't successful")
else:
print('Your Panorama is ready!!!')
# Final output
cv2_imshow(panorama)
cv2.waitKey(0)
cv2.destroyAllWindows()
```
````


.png?alt=media&token=c3fa24aa-cb41-4ae5-85f7-7877d43e3211)